Monitoring SkyPilot API Server Metrics#
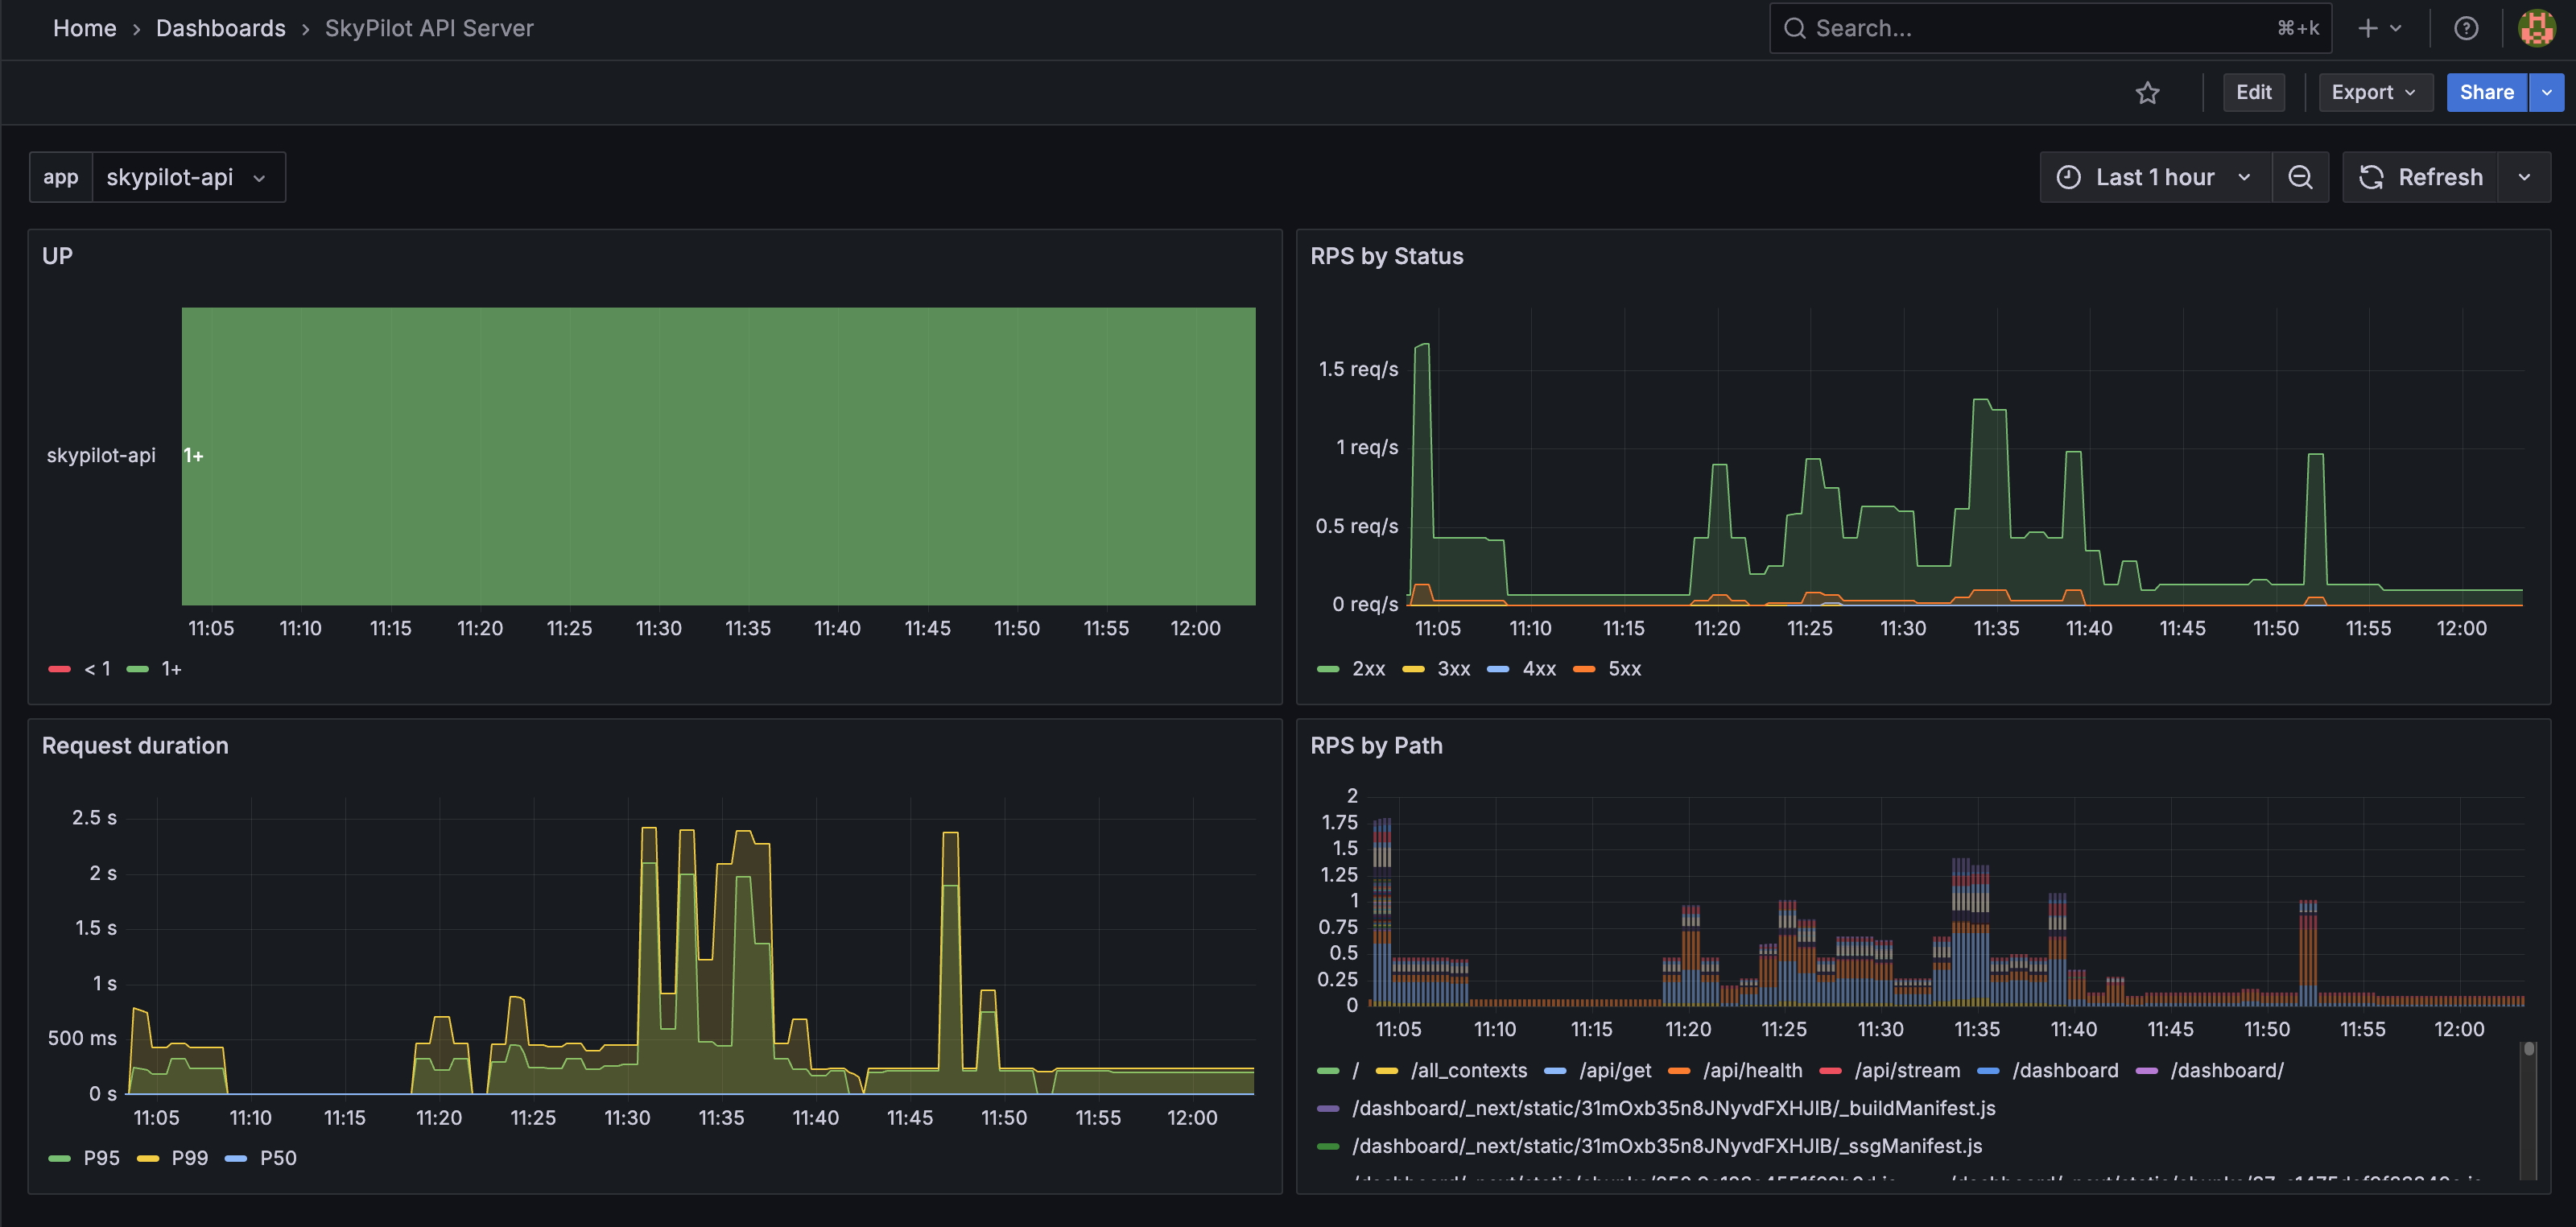
SkyPilot API Server can export Prometheus-compatible metrics and optionally deploy a one-click Prometheus + Grafana stack so that you get a fully functional monitoring solution out of the box.
Tip
Metrics are disabled by default. All the
knobs described below can be set via helm upgrade during the initial
installation or a later upgrade.
Quickstart: enable the full metrics stack#
If you do not already have Prometheus or Grafana running, the quickest way to get started is to let the SkyPilot Helm chart deploy everything for you with a single command:
helm upgrade --install skypilot skypilot/skypilot-nightly --devel \
  --namespace skypilot \
  --create-namespace \
  --reuse-values \
  --set apiService.metrics.enabled=true \
  --set prometheus.enabled=true \
  --set grafana.enabled=true
Turn off GPU metrics scraping
The above command also configures Prometheus to scrape the SkyPilot API server’s /gpu-metrics endpoint. To disable scraping of /gpu-metrics, append --set prometheus.extraScrapeConfigs="" to the Helm command:
helm upgrade --install skypilot skypilot/skypilot-nightly --devel \
  --namespace skypilot \
  --create-namespace \
  --reuse-values \
  --set apiService.metrics.enabled=true \
  --set prometheus.enabled=true \
  --set prometheus.extraScrapeConfigs="" \
  --set grafana.enabled=true
You can access Grafana at the /grafana endpoint:
# Fetch the endpoint URL
HOST=$(kubectl get svc ${RELEASE_NAME}-ingress-nginx-controller --namespace $NAMESPACE -o jsonpath='{.status.loadBalancer.ingress[0].ip}')
echo http://$HOST/grafana
Metrics exposed#
The endpoint /metrics on the SkyPilot API server exposes Prometheus-format
metrics covering:
API server health — request rate, latency, queue wait time, per-worker memory.
Cluster inventory by workspace, user, status, cloud, and kind (
cluster/managed_job/controller) — counts and GPU occupancy by accelerator model. Filterkind="cluster"to avoid overlap with managed-job clusters; sum across kinds for total resource usage.Managed jobs by workspace, user, status, and cloud (all statuses including terminal; use
delta(...)over a window for per-period success/failure rate).
You can also setup GPU metric collection to directly export GPU memory, utilization and power consumption from each compute cluster.
Forward metrics to an OpenTelemetry-based backend#
If your observability stack is built on OpenTelemetry (Datadog, Honeycomb, GCP Cloud Monitoring, Tempo + Mimir, etc.) rather than vanilla Prometheus, deploy an OpenTelemetry Collector as a bridge: its Prometheus receiver scrapes SkyPilot’s endpoints and an OTLP exporter forwards downstream.
The only SkyPilot-specific part is the scrape config — point it at the
API server Service (<release>-api-service.<namespace>.svc on the
metrics port, 9090 by default), and give /gpu-metrics a
scrape_timeout larger than the API server’s per-context federation
budget (20 s):
receivers:
  prometheus:
    config:
      scrape_configs:
        - job_name: skypilot-api
          metrics_path: /metrics
          static_configs:
            - targets: ['<release>-api-service.<namespace>.svc:9090']
        - job_name: skypilot-gpu
          metrics_path: /gpu-metrics
          scrape_timeout: 25s   # must exceed the 20s per-context budget
          static_configs:
            - targets: ['<release>-api-service.<namespace>.svc:9090']
Configure the processors, OTLP exporter, pipelines, and Collector deployment mode per the Collector configuration docs — those are generic OpenTelemetry concerns.
Using existing Prometheus / Grafana#
The Helm chart introduces three new top-level blocks to provide flexibility in how you set up Prometheus and Grafana:
apiService.metrics.enabled– enables the/metricsHTTP endpoint on the SkyPilot API server.prometheus.enabled– deploys a prometheus instance configured to scrape the/metricsendpoint on the SkyPilot API server.grafana.enabled– deploys Grafana with a pre-baked dashboard to display the SkyPilot API server metrics from prometheus.
All three default to false so you can mix & match:
Fully managed Prometheus + Grafana – set
apiService.metrics.enabled: true,prometheus.enabled: true, andgrafana.enabled: true. The chart will deploy a fully managed Prometheus + Grafana stack.External Prometheus / Grafana – set only
apiService.metrics.enabled: true. The API server will expose the metrics on the/metricsendpoint and the pod will be annotated withprometheus.io/scrape: trueto enable automatic scraping by prometheus.External Grafana, internal Prometheus – enable
prometheusbut disablegrafana. Point your existing Grafana at the Prometheus service created by the chart.