Monitoring Cluster-wide GPU Metrics#
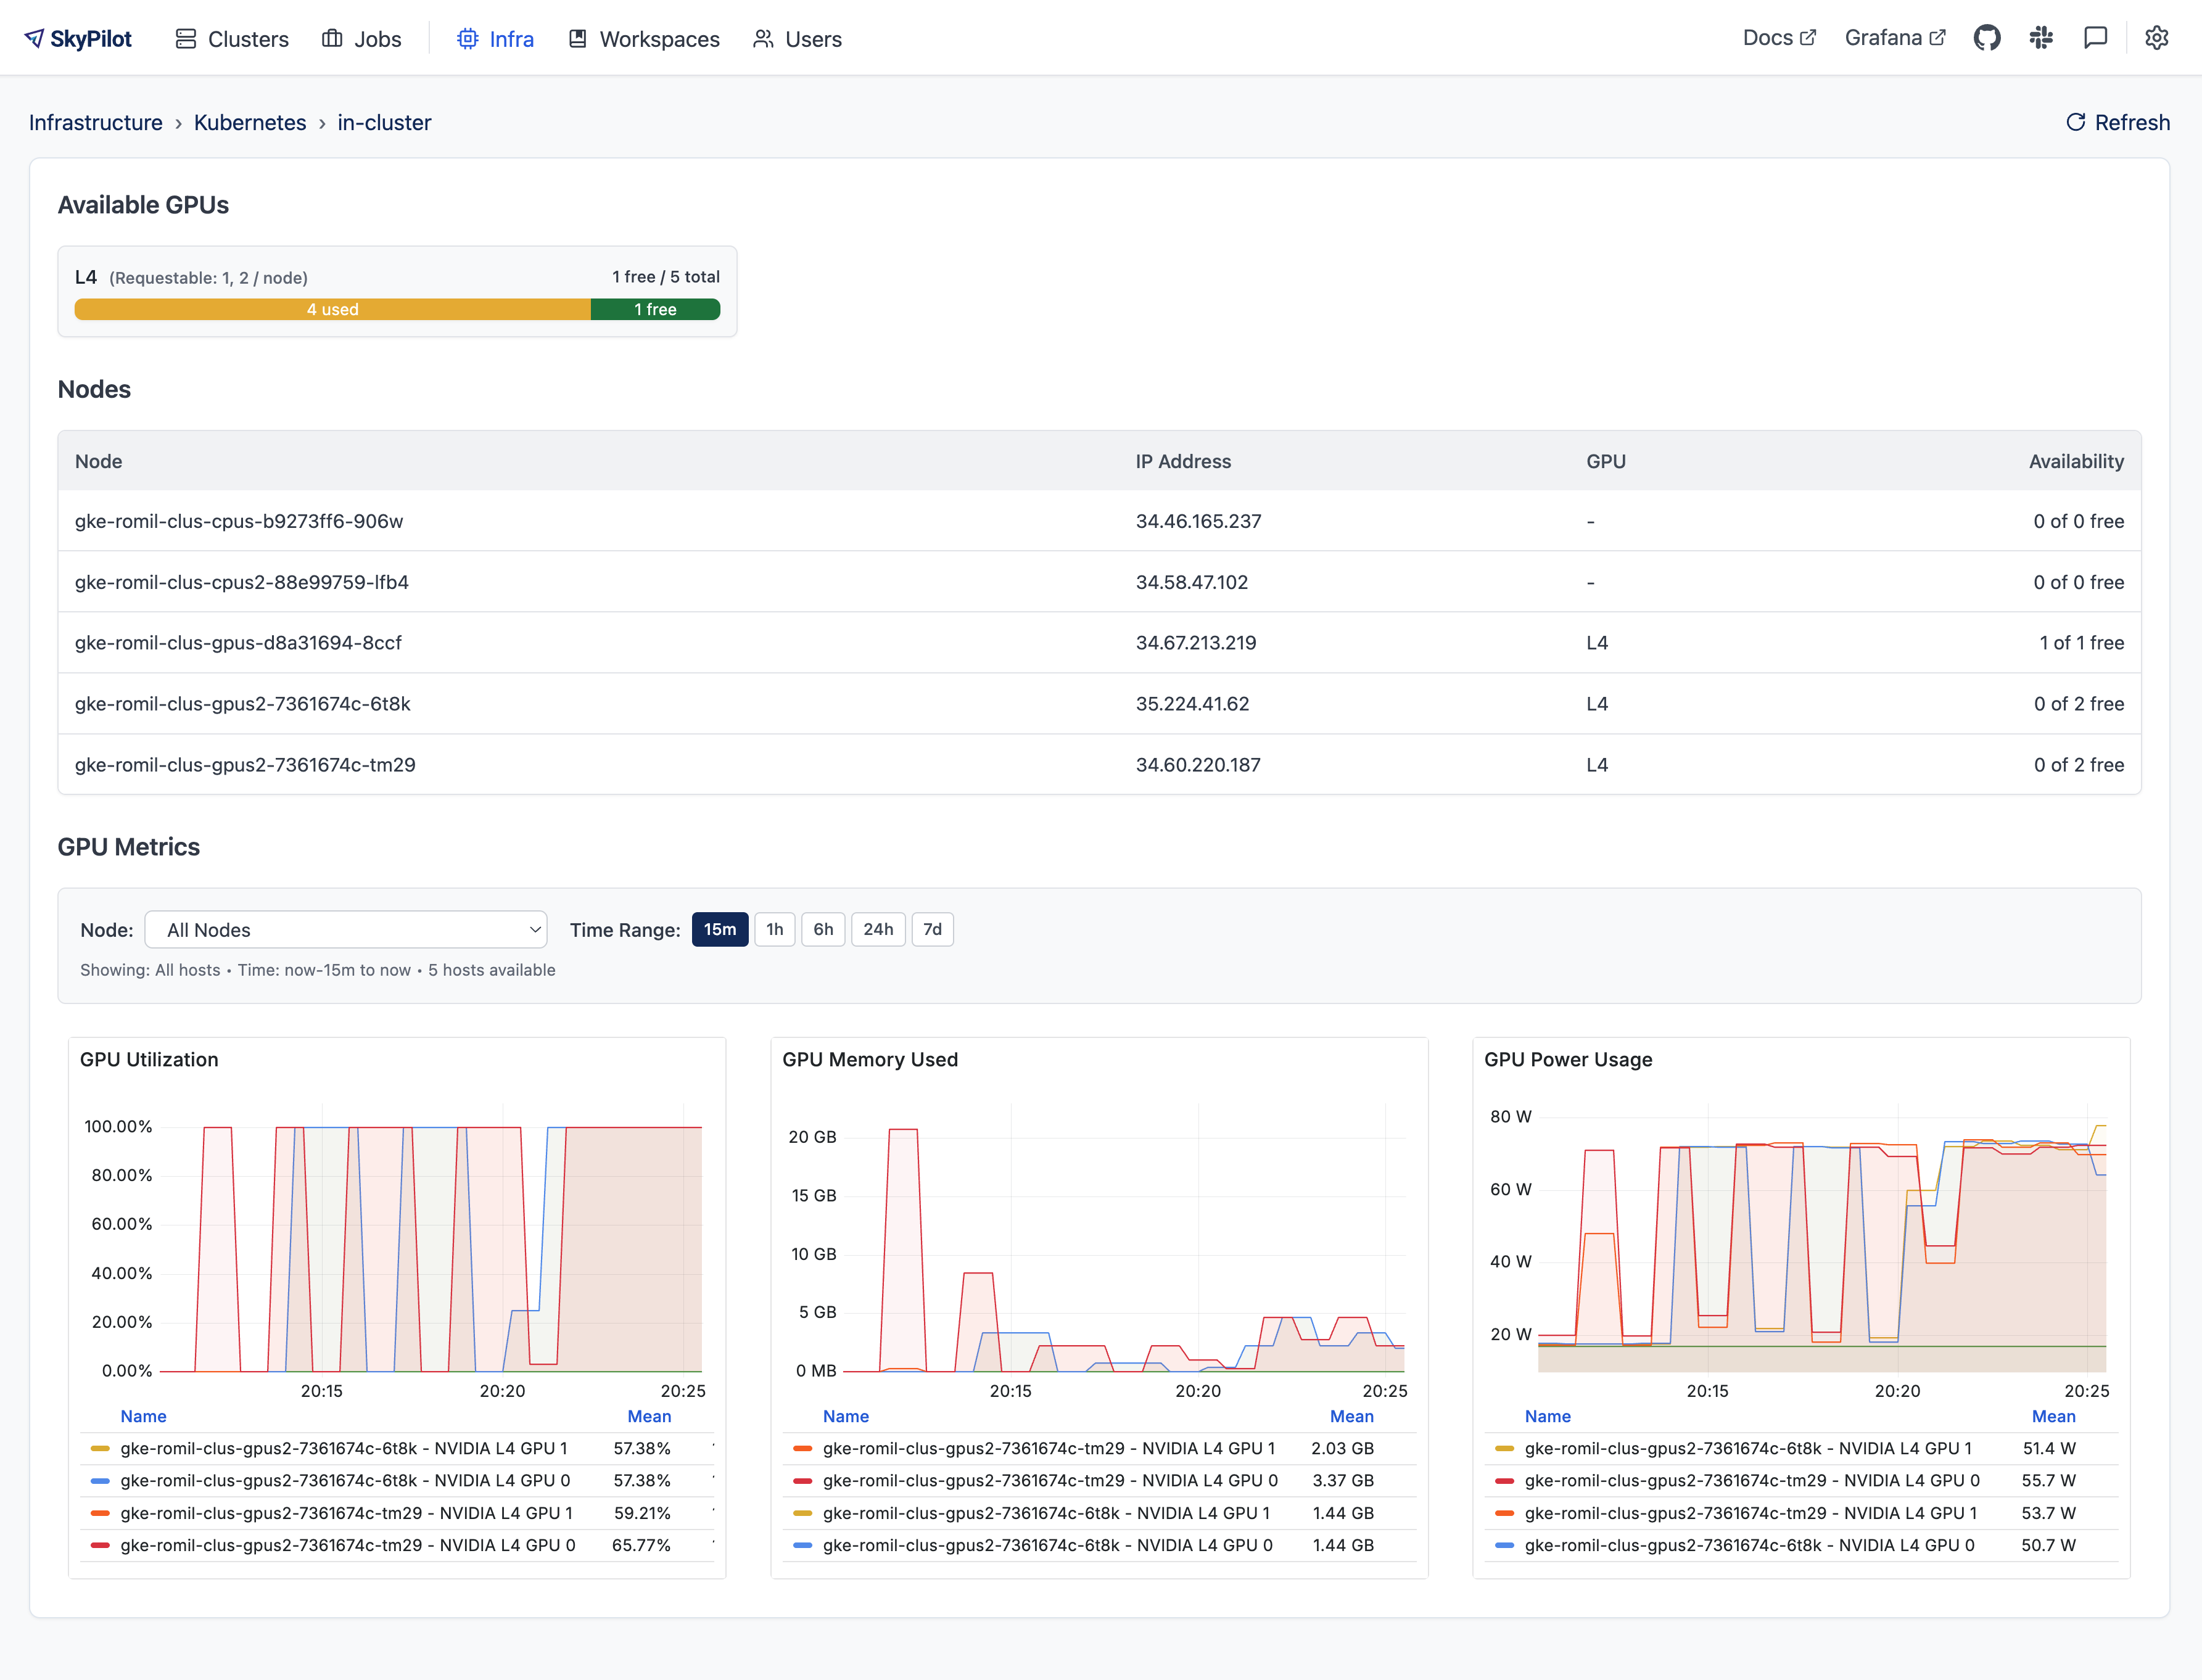
SkyPilot provides native integration with NVIDIA DCGM to surface real-time GPU metrics directly in the SkyPilot dashboard.
Prerequisites#
Before you begin, make sure your Kubernetes cluster meets the following requirements:
NVIDIA GPUs are available on your worker nodes.
The NVIDIA device plugin or the NVIDIA GPU Operator is installed.
DCGM-Exporter is running on the cluster and exposes metrics on port
9400. Most GPU Operator installations already deploy DCGM-Exporter for you.Node Exporter is running on the cluster and exposes metrics on port
9100. This is required only if you want to monitor the CPU and Memory metrics.
Check the dcgm exporter setup#
Verify that Prometheus scrape annotations are correctly configured for DCGM-Exporter.
Check whether the DCGM-Exporter Pod has the required Prometheus scrape annotations:
kubectl get pod $POD_NAME --namespace $NAMESPACE -o jsonpath='{.metadata.annotations}'
where $POD_NAME is the DCGM-Exporter Pod name and $NAMESPACE is its namespace. For CoreWeave managed Kubernetes clusters, the namespace is cw-exporters.
Confirm the following annotations exist:
prometheus.io/scrape: "true"
prometheus.io/port: "9400"
prometheus.io/path: "/metrics"
If the Pod already has these annotations, skip the rest of this section.
If not, check whether a Service for DCGM-Exporter exists:
kubectl get svc -n $NAMESPACE | grep "dcgm-exporter"
where $NAMESPACE is the DCGM-Exporter namespace.
2.1 If the Service exists, verify its Prometheus scrape annotations:
kubectl get svc $SERVICE_NAME -n $NAMESPACE -o jsonpath='{.metadata.annotations}'
Confirm the following annotations exist:
prometheus.io/scrape: "true"
prometheus.io/port: "9400"
prometheus.io/path: "/metrics"
If any are missing, edit the Service to add them.
kubectl edit svc $SERVICE_NAME -n $NAMESPACE
2.2 If the Service does not exist, create it:
kubectl create -f https://raw.githubusercontent.com/skypilot-org/skypilot/refs/heads/master/examples/metrics/dcgm_service.yaml -n $NAMESPACE
where $NAMESPACE is the DCGM-Exporter namespace.
Check the node exporter setup#
Verify that Prometheus scrape annotations are correctly configured for Node Exporter.
Check whether the Node Exporter Pod has the required Prometheus scrape annotations:
kubectl get pod $POD_NAME --namespace $NAMESPACE -o jsonpath='{.metadata.annotations}'
where $POD_NAME is the Node Exporter Pod name and $NAMESPACE is its namespace. For CoreWeave managed Kubernetes clusters, the namespace is cw-exporters.
Confirm the following annotations exist:
prometheus.io/scrape: "true"
prometheus.io/port: "9100"
prometheus.io/path: "/metrics"
If the Pod already has these annotations, skip the rest of this section.
If not, check whether a Service for Node Exporter exists:
kubectl get svc -n $NAMESPACE | grep "node-exporter"
where $NAMESPACE is the Node Exporter namespace.
2.1 If the Service exists, verify its Prometheus scrape annotations:
kubectl get svc $SERVICE_NAME -n $NAMESPACE -o jsonpath='{.metadata.annotations}'
Confirm the following annotations exist:
prometheus.io/scrape: "true"
prometheus.io/port: "9100"
prometheus.io/path: "/metrics"
If any are missing, edit the Service to add them.
kubectl edit svc $SERVICE_NAME -n $NAMESPACE
2.2 If the Service does not exist, create it:
kubectl create -f https://raw.githubusercontent.com/skypilot-org/skypilot/refs/heads/master/examples/metrics/node_exporter_service.yaml -n $NAMESPACE
where $NAMESPACE is the Node Exporter namespace.
Prometheus setup#
In the cluster where you deploy the API server, Prometheus is installed automatically as part of Set up DCGM metrics scraping.
For other Kubernetes clusters (external clusters), deploy Prometheus manually. By default, SkyPilot scrapes metrics from external clusters through a Service named skypilot-prometheus-server in the skypilot namespace. If your Prometheus is deployed under a different namespace, service name, or port, set the metrics.prometheus fields in the SkyPilot config accordingly.
First, create a prometheus-values.yaml file with the following configuration:
server:
  persistentVolume:
    enabled: true
    size: 50Gi
  retention: "1000d"
  retentionSize: "43GB"
  # scrape_timeout must be longer than the SkyPilot API server's
  # _PER_CONTEXT_TIMEOUT_SECONDS (20s in sky/server/metrics.py),
  # otherwise this Prometheus will time out scraping /gpu-metrics on
  # large clusters and mark the api-server target as down.
  global:
    scrape_timeout: 30s
kube-state-metrics:
  enabled: true
  metricLabelsAllowlist:
    - pods=[skypilot-cluster,skypilot-cluster-name]
prometheus-node-exporter:
  enabled: false
prometheus-pushgateway:
  enabled: false
alertmanager:
  enabled: false
Then install Prometheus using skypilot-prometheus as the release name (this creates the required skypilot-prometheus-server service):
helm repo add prometheus-community https://prometheus-community.github.io/helm-charts
helm repo update
helm upgrade --install skypilot-prometheus prometheus-community/prometheus \
  --namespace skypilot \
  --create-namespace \
  -f prometheus-values.yaml
Verify the service was created:
kubectl get svc skypilot-prometheus-server -n skypilot
Refer to the Prometheus helm chart values for additional configuration options.
Note
Do not use the Prometheus Operator (kube-prometheus-stack) for GPU metrics.
The Prometheus Operator adds an exported_ prefix to pod and namespace labels,
which breaks the PromQL queries used by SkyPilot.
If you are using the Nebius Kubernetes cluster, refer to Setup GPU metrics in Nebius Kubernetes cluster for how to setup the GPU metrics.
Set up DCGM metrics scraping#
Deploy the SkyPilot API server with GPU metrics enabled:
helm upgrade --install skypilot skypilot/skypilot-nightly --devel \
  --namespace skypilot \
  --create-namespace \
  --reuse-values \
  --set apiService.metrics.enabled=true \
  --set prometheus.enabled=true \
  --set grafana.enabled=true
The flags do the following:
apiService.metrics.enabled– turn on the/metricsendpoint in the SkyPilot API server.prometheus.enabled– deploy a Prometheus instance pre-configured to scrape both the SkyPilot API server and DCGM-Exporter.grafana.enabled– deploy Grafana with an out-of-the-box dashboard that will be embedded in the SkyPilot dashboard.
What metrics are exposed?#
By default, the SkyPilot dashboard exposes the following metrics:
GPU utilization
GPU memory usage
GPU power usage
GPU temperature
CPU utilization
Memory usage
However, all metrics exported by DCGM exporter can be accessed via Prometheus/Grafana including GPU errors, NVLink stats and more.